Our Projects
Healthcare
Project Vida Opioid Mobile Clinic mostbet casinopinup1win
Project approach
Project Vida is targeted at providing healthcare services to patients suffering from opioid addiction. They operate through ground staff going into the communities and reaching out to the people who need the support. Each patient is registered using a form and the data is then stored in a database. They wanted to develop a front end app for the data collection, as well as a way to store the data such that it is queryable and thus actionable.. Sparrow Analytics helped them in achieving
the same by: –
● Theorizing and planning with the team on the design of the app, intended outcomes from data queries and org structure of the team which will be using the system
● Developing a front end Android mobile app to collect the data and a dynamic web console to access the data and manage the admin credentials and activity of all ground staff.
● The app has functions like User(ground staff) registration with 2FA, patient registration under each user, collect data for patient, edit old records of patients, print PDFs of patients if needed. The app is multilingual and can toggle between English and Spanish modes.
● The Admin web console is the backend for all the users for the app. It has features like User access management, analytics dashboard, patient record search and edit patient records. It can also allow the admin to retrieve all the visits to the same patient in a time sequence manner.
Impact Created:
● Project Vida has about 30+ ground staff called peers who have started using the app to collect the data and store directly in the database
● Analytics have allowed the administrators to identify patterns in the behavior of service utilisation of the patients who go back to addiction while the ones who have been cured.
● The next phase of the project involves developing a GIS based tool to identify hotspots for addiction and their types in the community.
● Once the hotspots are identified, it will be possible to link the patients registered on the project vida application with other social services that they are in need of and are eligible for .eg: housing, food etc.


GIS
Project approach
The Department of Sports & Youth Affairs (DSYA) Haryana requested the development of a geospatial decision support system that would help with resource planning & allocation such that all tehsils & districts of the state get adequate sporting infra coverage. This was achieved by: –
● Collating all the geotagged location data for all the sporting infrastructure – DSYA owned, Panchayati Raj owned and privately owned.
● Conducting proximity analysis on all the geotagged locations and habitations, villages, towns & cities.
● Preparing a list of habitations (villages, tehsils, towns & cities) that fall within the designated serviceable area around each sporting venue and another list of those that fall outside of this serviceable area.
● Considering the data on unserviced areas while deciding on new sporting infrastructure and upgrading the old one.
● The spatial spread and pockets of influence of sporting disciplines too considered while deciding on the infrastructure planning.
Impact Created:
● GIS philosophy and GIS-assisted decision making is now a part of the DSYA Haryana work culture.
● A dynamic tool created that has multiple layers and can be used by anyone – from the minister to the lower rung officials.
● Human bias was replaced with scientific decision-making leading to all stakeholders being equally heard and made a part of the process.
● All new sporting infra requests are now taken up in a defined process, with a quick & well-thought out decision-making.
● The entire work is now a part of the CM Haryana GIS portal, a public website to view Haryana government’s different assets on a geospatial interface.

GIS based mapping of locations of all sporting facilities.

GIS based analysis of non associated villages. These are villages which are outside the impact radius / catchment area of the geolocated sporting facilities.
GIS
Climate Change MItigation and Monitoring Center
Project approach
The Chandigarh administration had been planning to setup a climate change mitigation and monitoring cell within their existing infrastructure but were in need of technical expertise to achieve that. Sparrow Analytics helped them in achieving the same by: –
● Theorizing and planning with the team on the possible use cases, its intended outcome and impact
● Developing a dynamic GIS based location intelligence platform based on Free-and-Open-Source-Software (FOSS) philosophy.
● Developing 3 distinct use cases (Vegetation Indices, Urban Heat Islands & Land Cover Classification) in Phase I of the project with all the algorithms written in-house and
encoded into the application.
● Establishing a data pipeline using APIs for satellite imagery acquisition from USGS Earth Explorer and ESA’s Sentinel-2 platform.
● Geoprocessing functions encoded into the application making it an end-to-end fully automated application.
● Developing AI based image analysis tool using algorithms for Machine Learning, Spatial Clustering analysis.
Impact Created:
● Chandigarh Administration, through its Environment Department, became the first state or UT government that operates such a sophisticated platform.
● Environment Department team is now able to issue heat island advisories within the city, based on the processed satellite imagery.
● Land Cover Classification tool now allows the UT Administration to keep an eye on the
Water Bodies, Forest & Tree Canopy Cover and Area under Agriculture, amongst many other things.
● The Administration is now able to watch over the vegetation health over a large geographic area with minimal effort. Rather, the resources are now deployed efficiently based on the inputs received from the Dashboard.

GIS based classification of Land Use. It uses an AI based image analysis algorithm to identify Land use types.
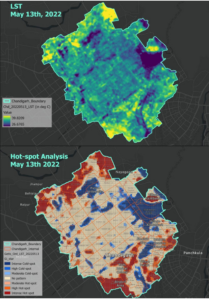
GIS based identification of Urban Health islands based on date specific imagery from Satellite Data. The system is fully automated and can generate weekly reports instantly.
Healthcare
COVID management tool MAPSIGHTS
Project approach
During the CoVid-19 lockdown in 2020, Sparrow Analytics supported in setting up a geospatial
dashboard in the CM Office control room, Chandigarh to continually monitor different aspects of
the pandemic and the lockdown. This was achieved by:
● Creating a standalone geospatial dashboard that could ingest data from multiple department data sources
● Applying Spatial Science & Analytics along with concepts from Epidemiology, to create relevant data insights on a GIS interface.
● Explaining the statistical and spatial concepts for the field staff of Haryana Govt, to create & maintain a robust data pipeline through the lockdown period.
● Allowing the users to create their own customized data insights for varied applications and situations arising out of lockdown.
● Helping key departments such as Health & Family Welfare, CID wing of Haryana Police, Food & Civil Supplies set up their own GIS pipelines and dashboards.
● This effort was awarded as one of the Best Solutions in Pandemic Management by MIT USA in 2020.
Impact Created:
● Quick, data-driven insights delivered to the CM office for a statewide view of the emerging situation and enabling decision-making.
● It paved the way for the Haryana CM GIS portal where all the departments were
encouraged to geotag and digitize their data.
● The effort was recognized by MIT Solve as one of the technological solutions to counter the pandemic and its aftermath.
● Haryana emerged as an example of one the least impacted state by CoVid-19.
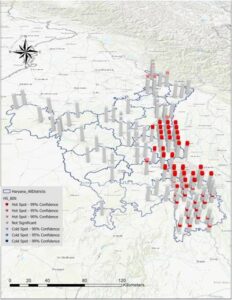
GIS based dashboard for location specific disease incidence and hotspot analysis. The data pipeline is fully automated and refreshed on daily numbers
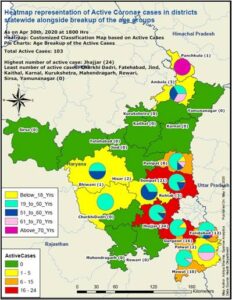
GIS based dashboard of disease incidence split by age group in specific locations. The data pipeline is fully automated and refreshed based on daily numbers.
GIS
CarbonWatch citizen app
Project approach
With the intent of developing a citizen-centric tool for the carbon footprinting of an individual’s lifestyle, the Sparrow Analytics team partnered with ENVIS team of Dept of Environment, UT of Chandigarh to develop a Carbon footprinting application by: –
● Creating a Citizen use Android and iOS application for mobile devices, for worldwide distribution.
● Creating 6 major lifestyle categories and then developing questionnaire based on them.
● Researching on possible carbon footprints from these 6 categories including material from peer reviewed articles.
● Simplifying the research into broad areas, linking each of them to human lifestyle and quantifying the tonnes of Carbon dioxide (CO2) equivalent being emitted as a result.
● Sensitizing the people of Chandigarh and outside, through awareness programs in partnership with Chandigarh administration.
● Creating an admin dashboard that saves all the carbon footprinting data of users to draw trends and inferences for Chandigarh & non-Chandigarh users.
Impact Created:
● Every citizen of the city and otherwise, can now measure their individual carbon footprint with the contextualization to local conditions of the background data being complete.
● Chandigarh’s initiative became the first of its kind for any State or UT in India.
● Chandigarh administration has now been able to sensitize the citizens and connect with many of them through this app, creating a win-win situation for all.


CarbonWatch app allows citizens to compute their own carbon footprint. It is the first of its kind Citizen facing app for any govt dept in India.
Epidemiology
map sights 1.0
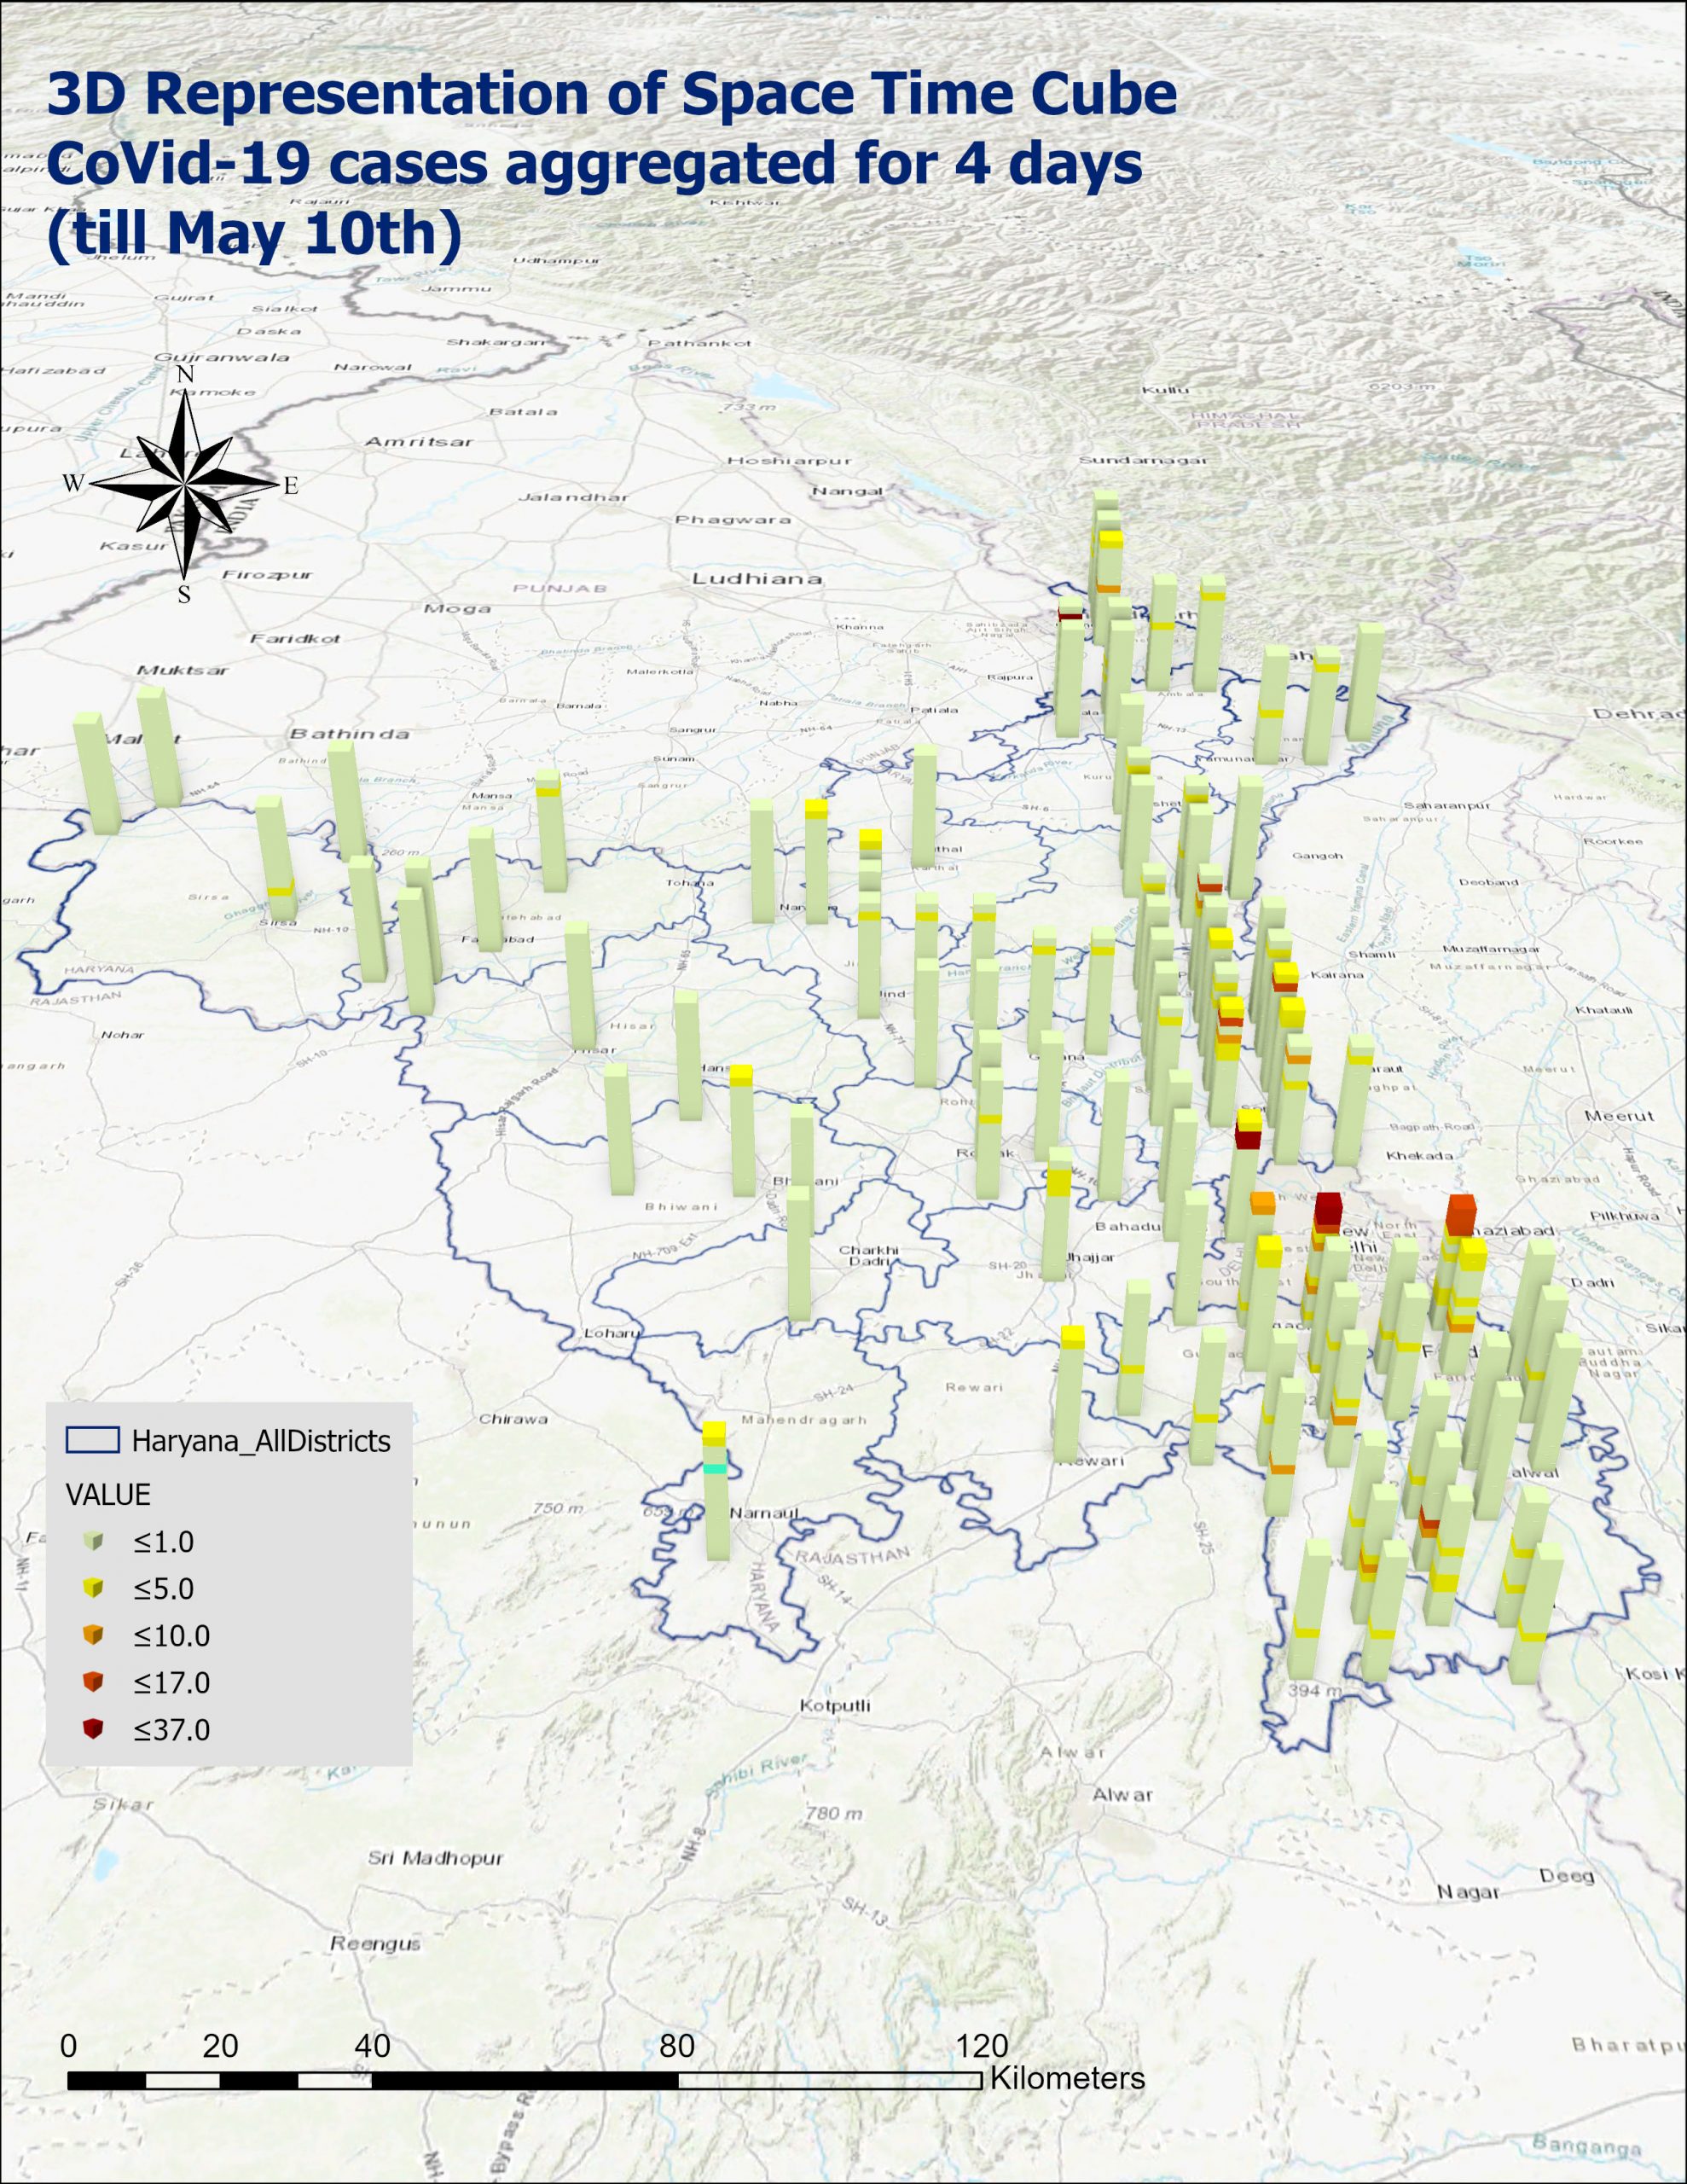
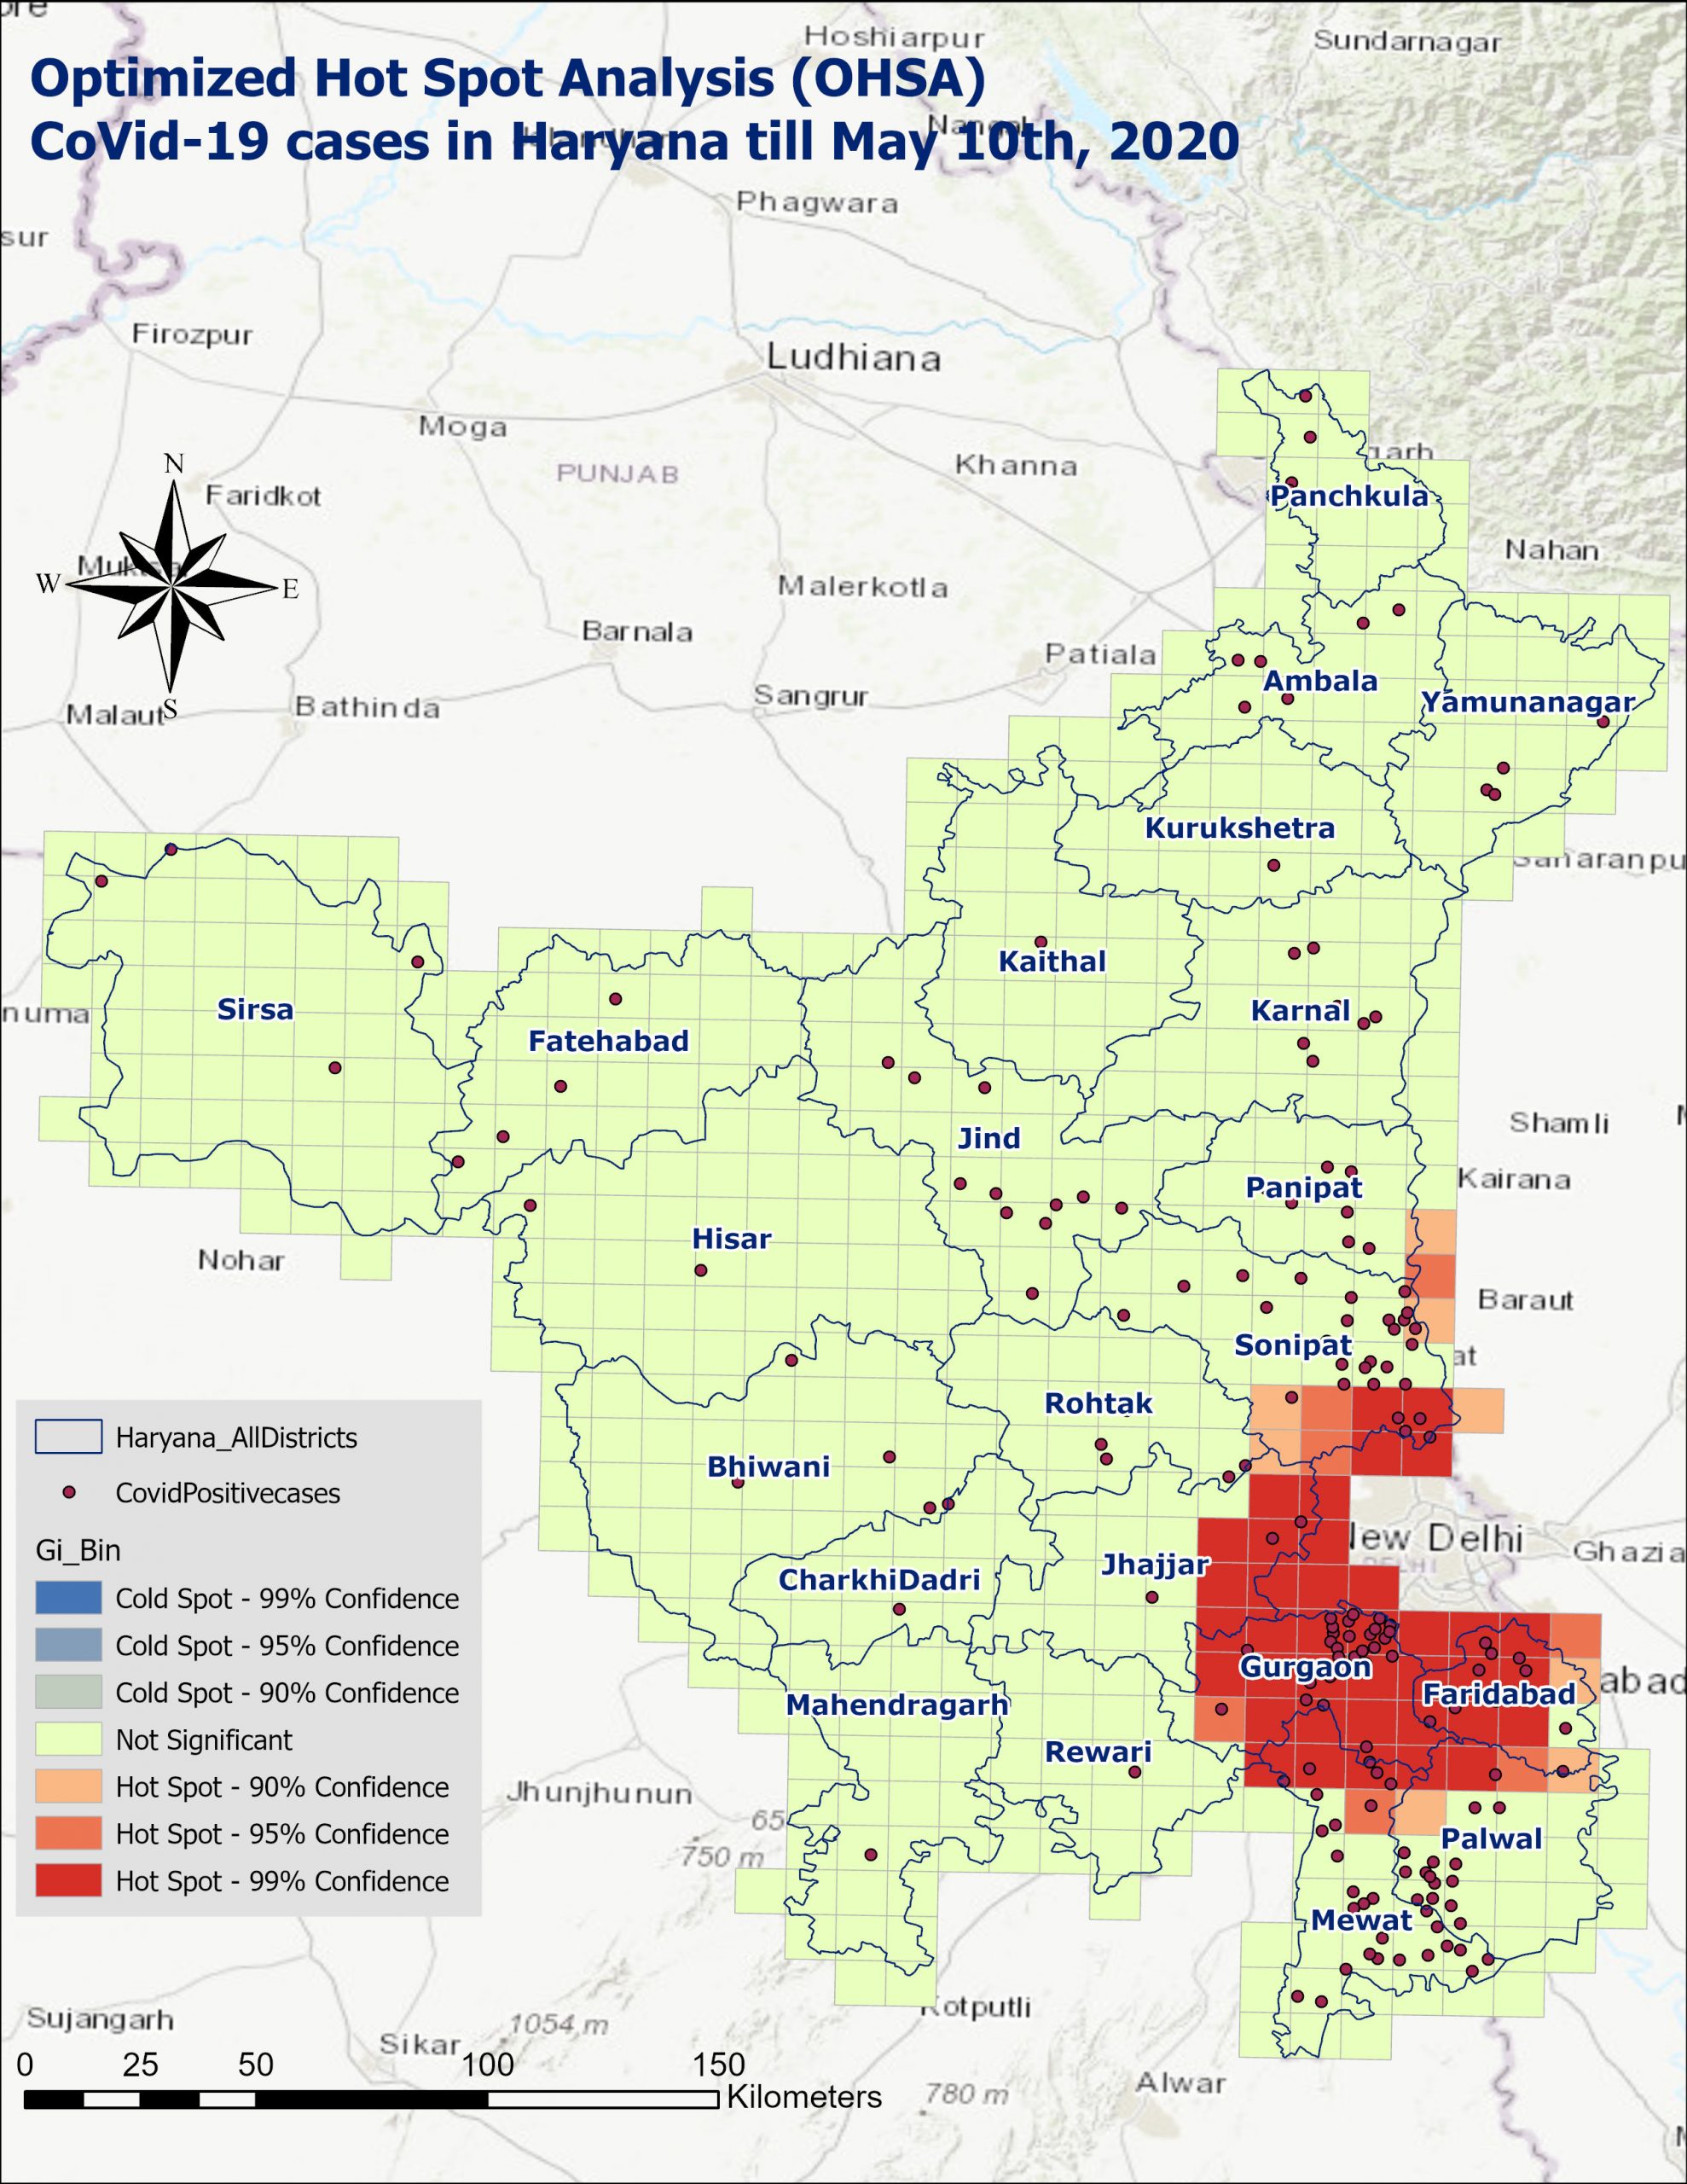
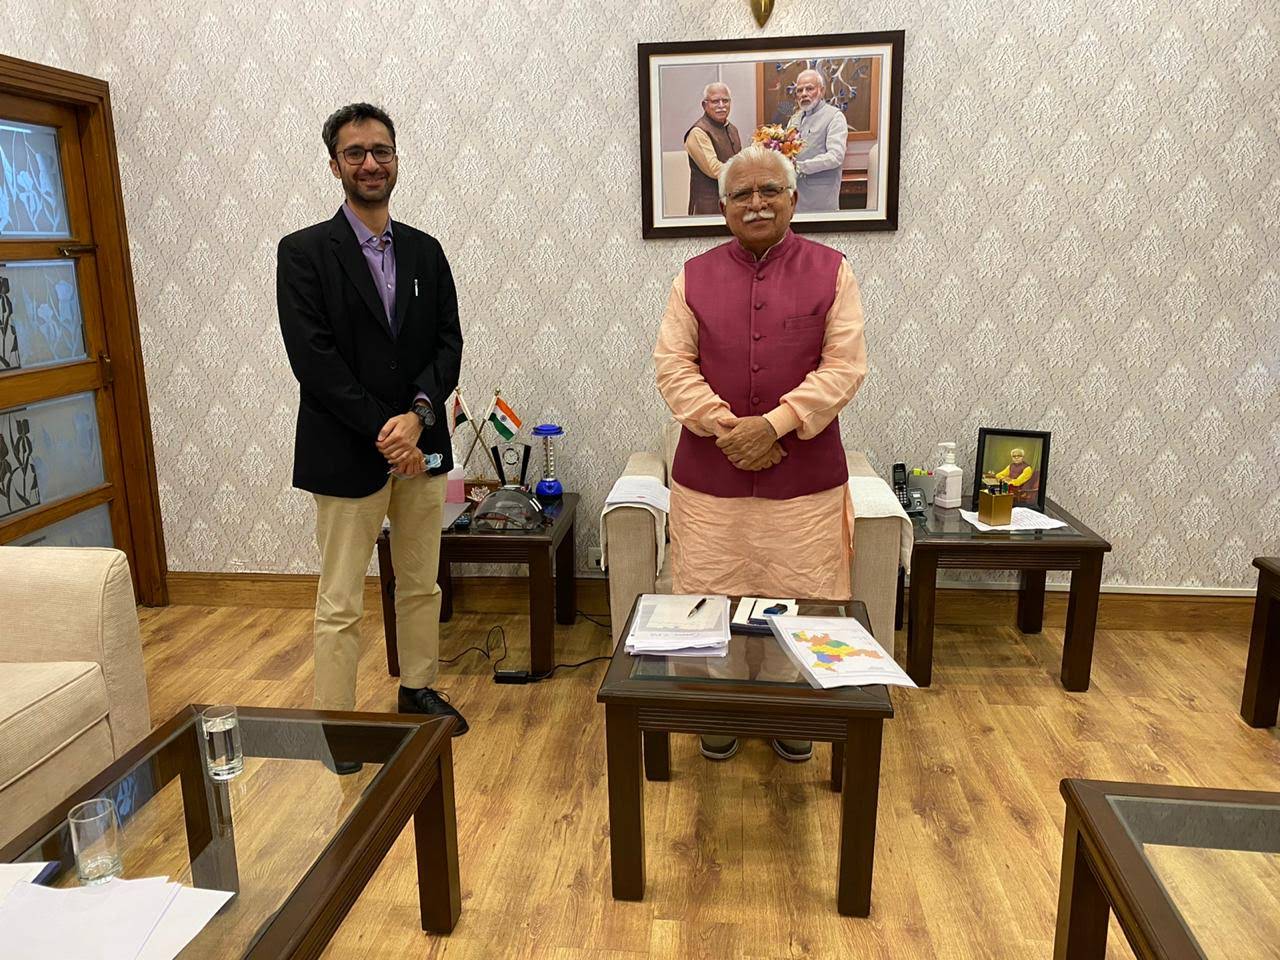
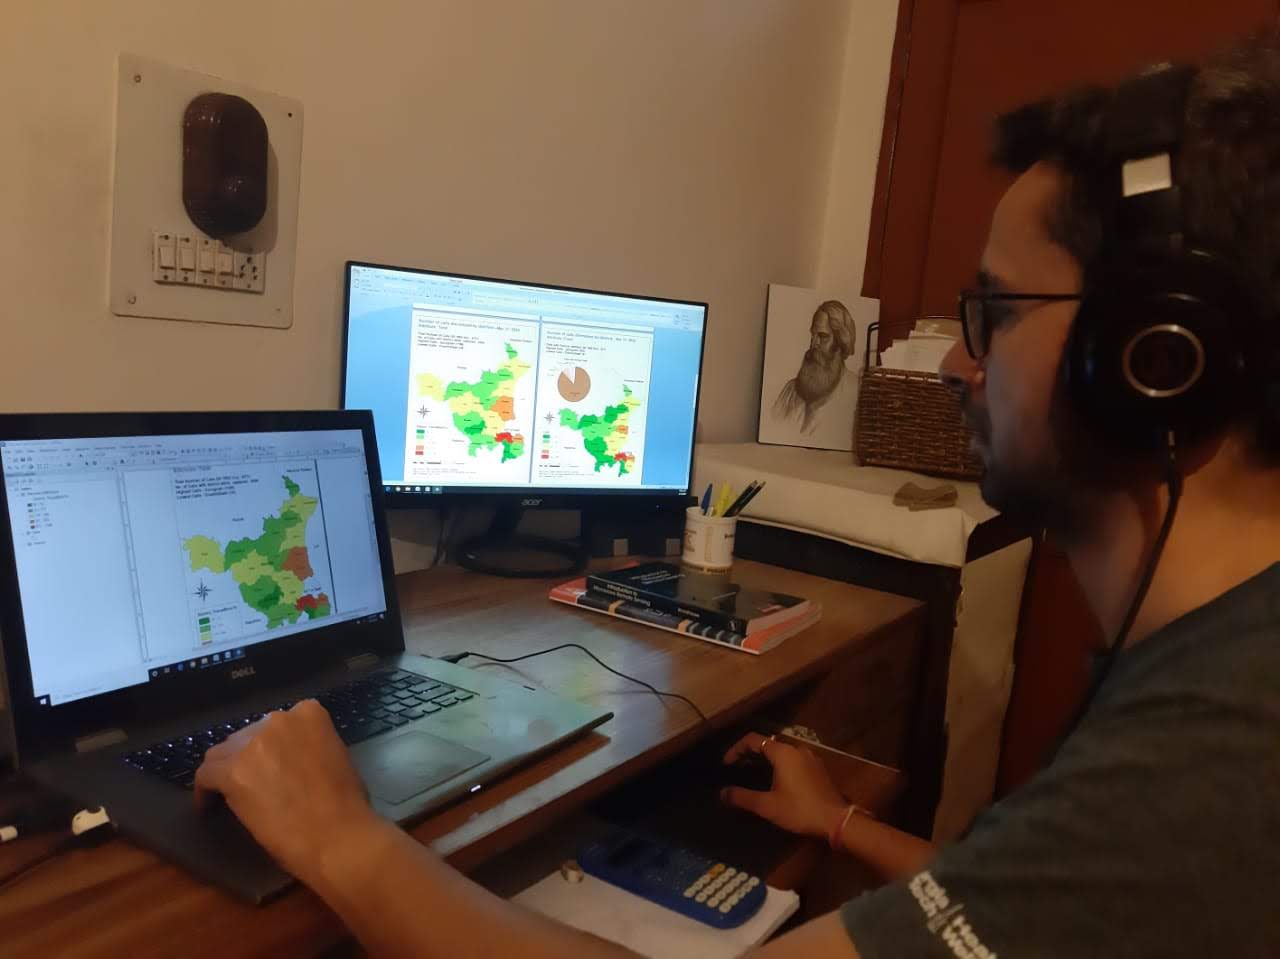
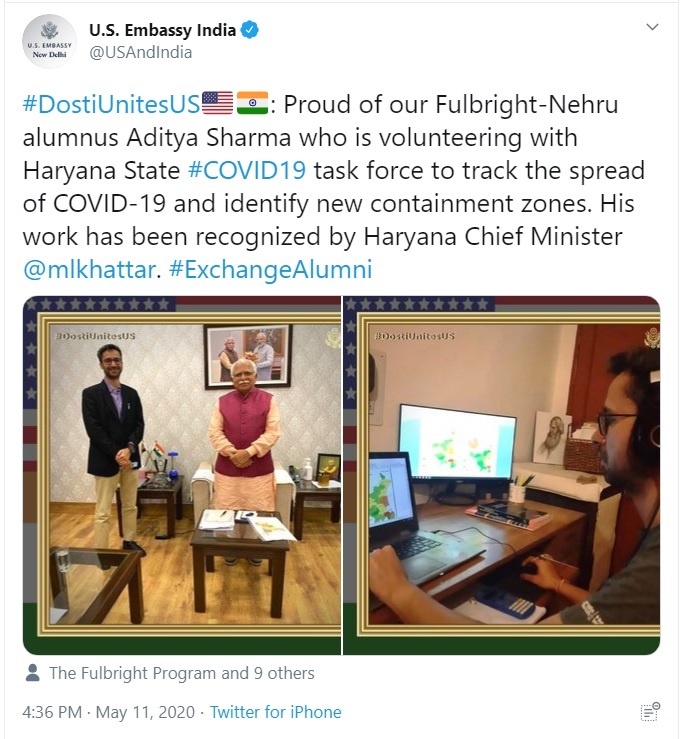
Implemented the GIS enabled analytics platform for pandemic mapping and mitigation strategies. Integration of field and the historic data, along with necessary geo-coding helped the state of Haryana to draw extremely useful insights during the Lockdown phases 1.0 to 4.0. The data insights would help not just with the containment, but also with the ripple effects of the pandemic such as food relief, transportation and grievance redressal.
At the front-end of the application, the dashboard was an earnest attempt in making our frontline CoVid-19 warriors, our planners and the people, aware and equipped to take informed decisions. While at the back-end, it integrated databases, to predict with higher accuracy the commonly used epidemiological parameters and generate a continuous data time series.
This consultative work was on a pro-bono basis as part of our social responsibility commitment.
Environmental Fluid Mechanics
Springshed development
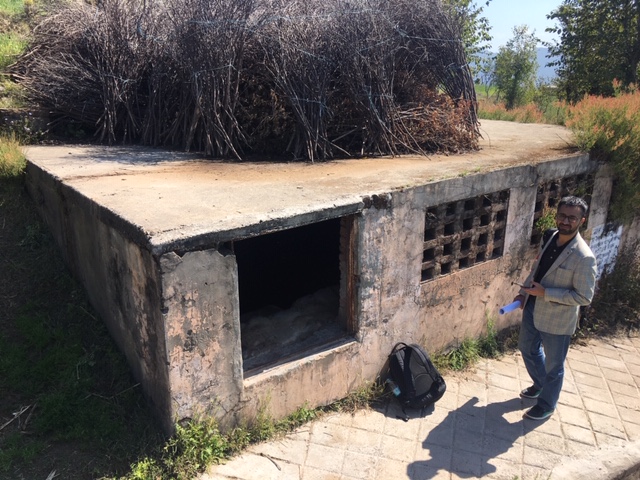
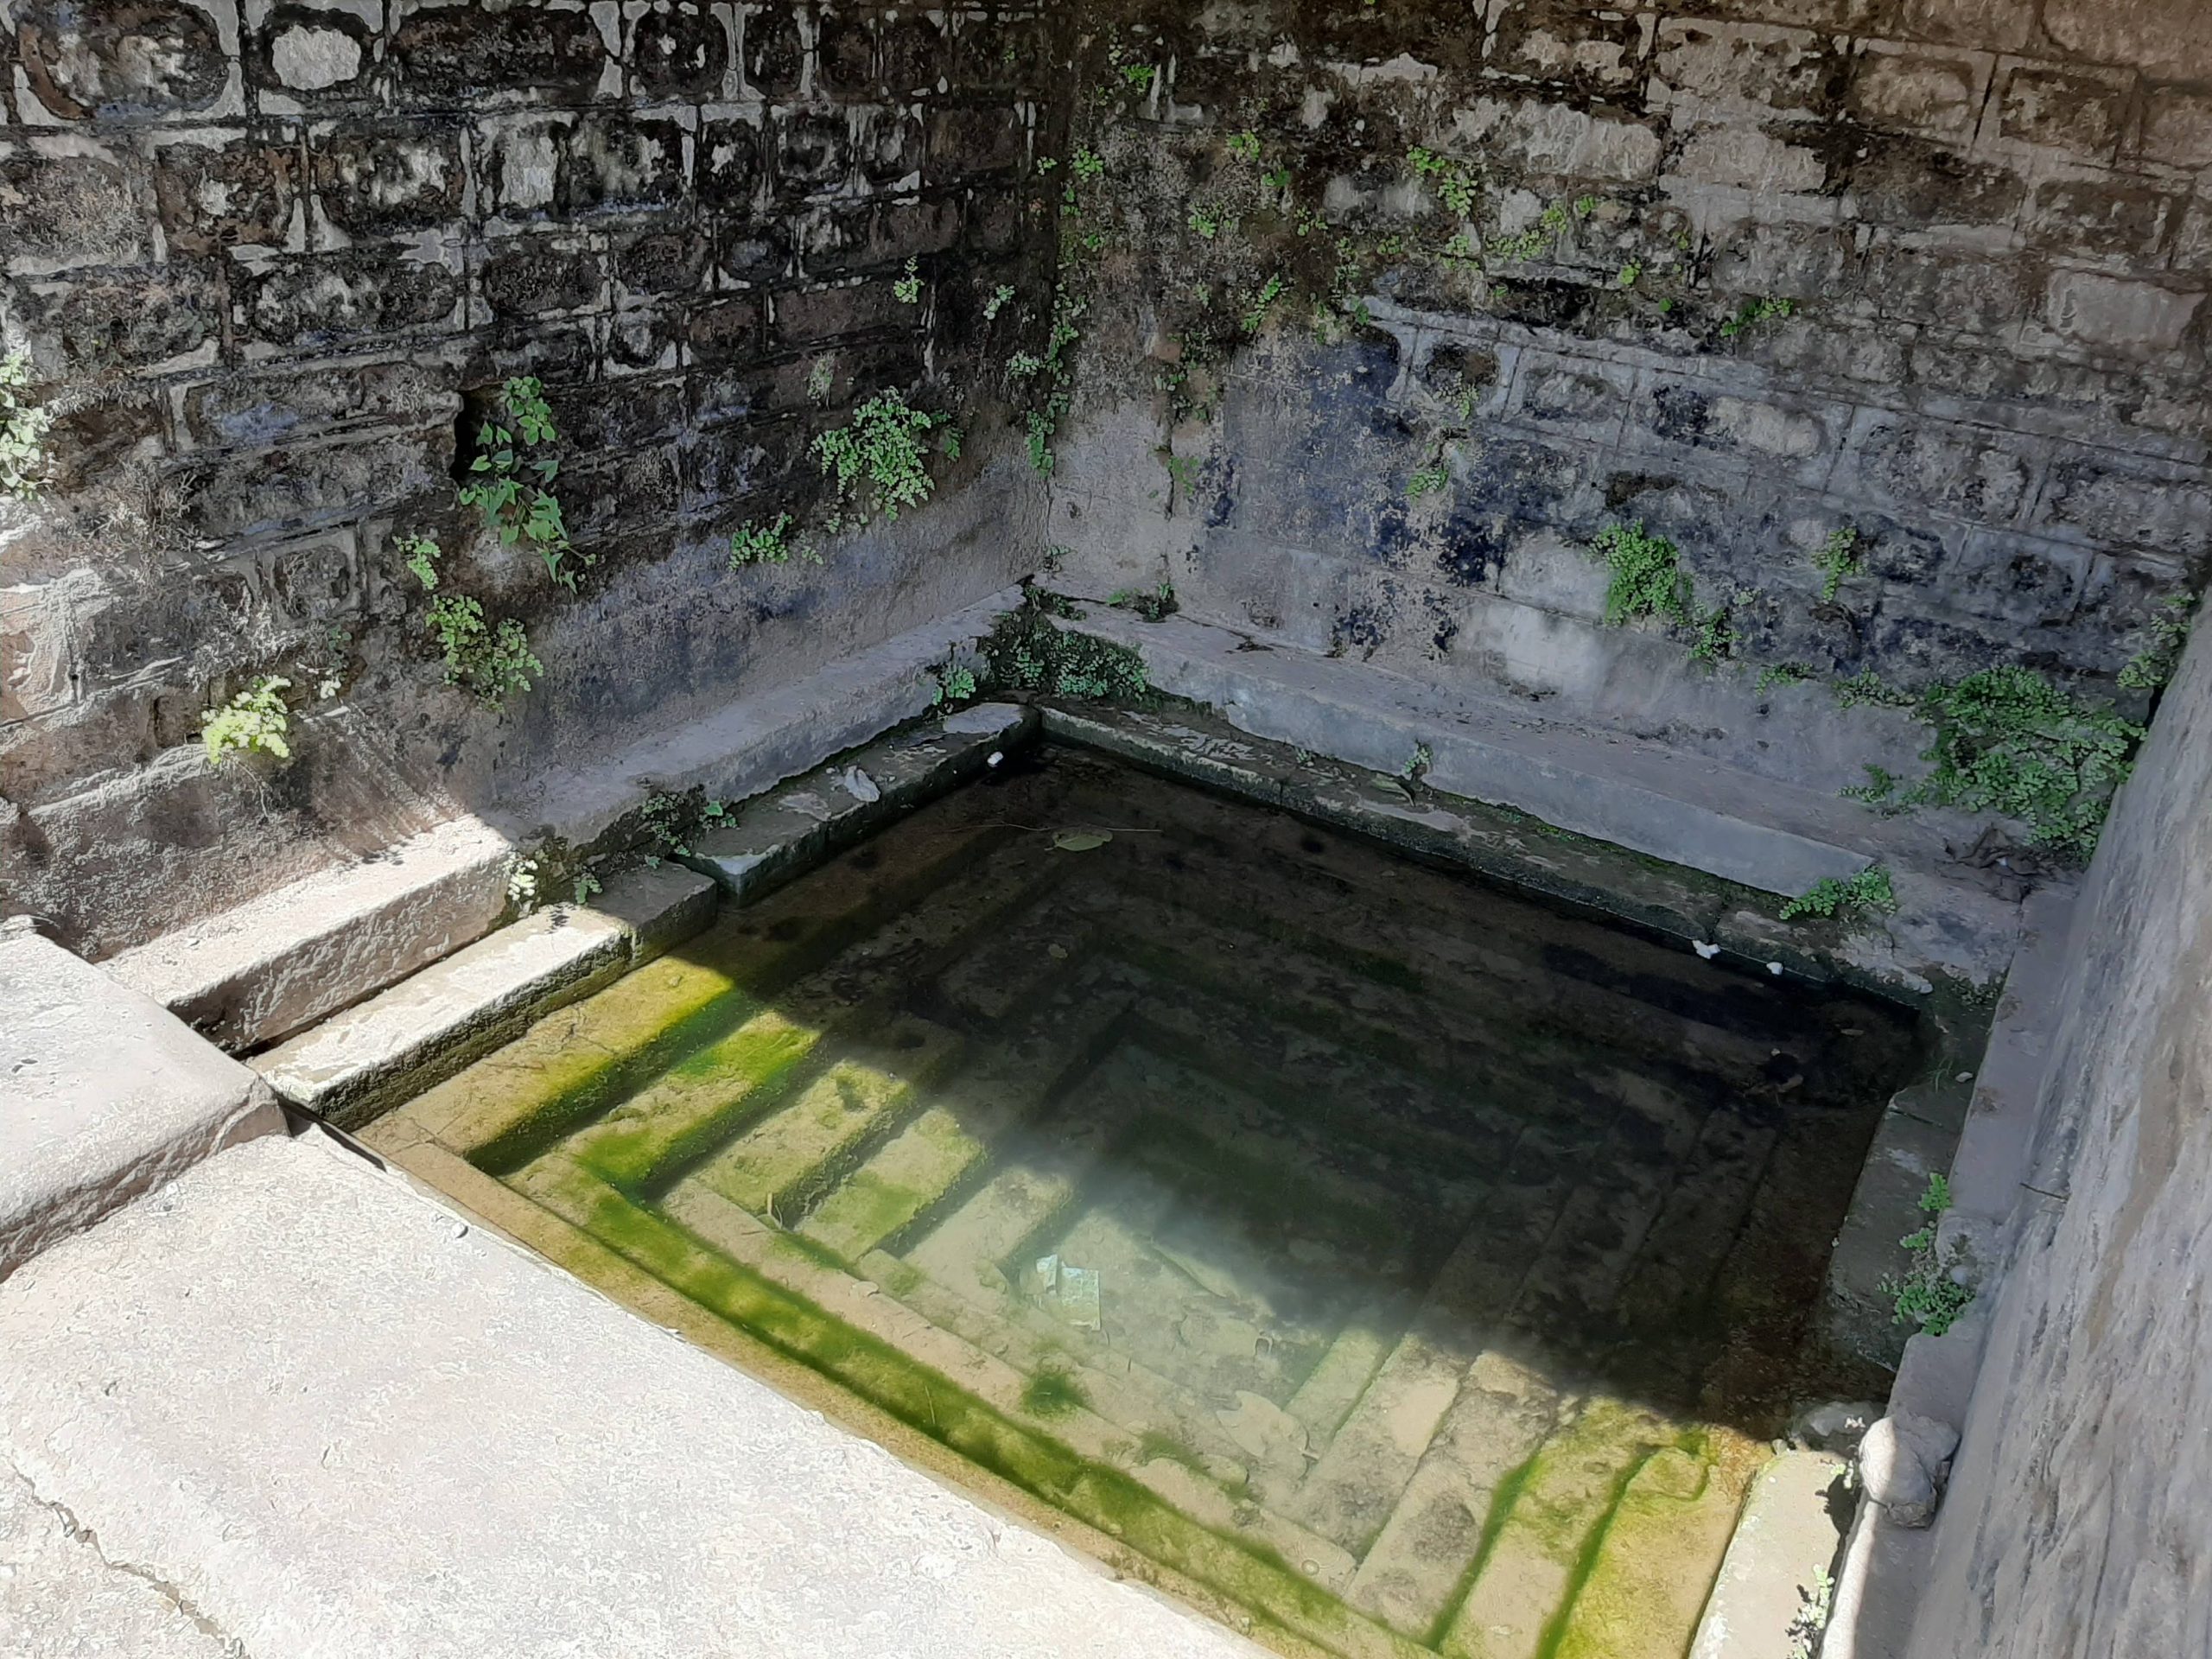
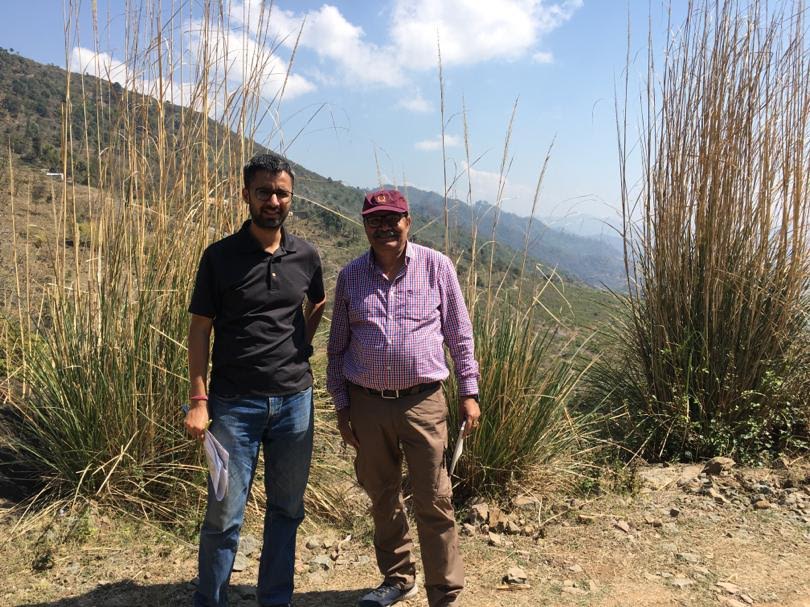
The gram panchayat of Mitian in Nalagarh tehsil of Solan, is home to numerous fracture springs and rain-fed ponds which were now producing less water each year due to the change in rainfall patterns, loss of moisture retention capability and other anthropogenic factors.
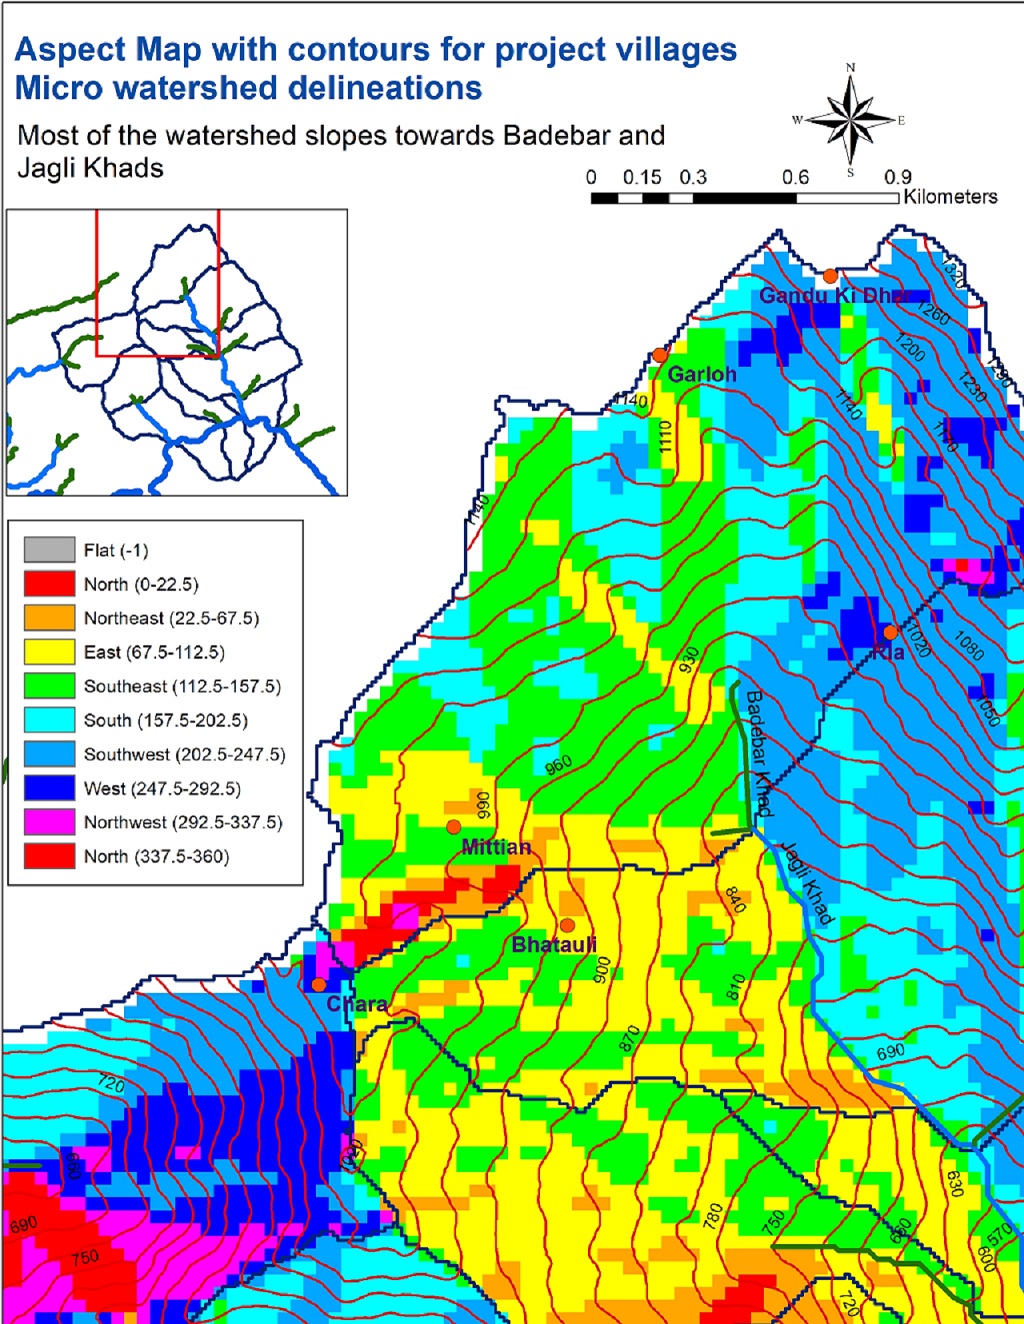
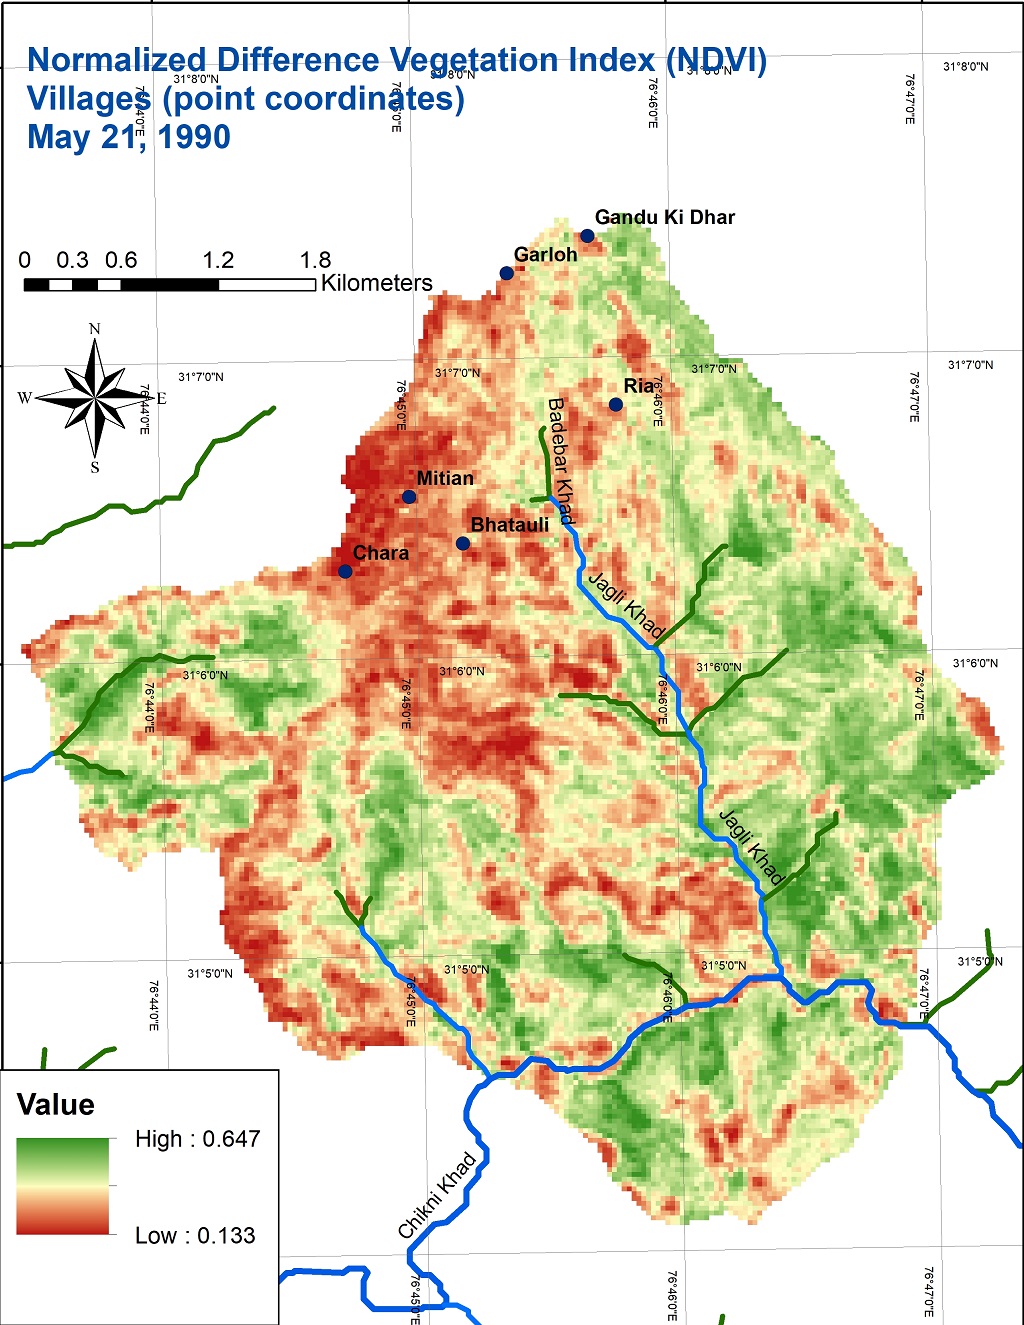
With support from Ambuja Cement Foundation, we completed a full hydrogeological assessment of the area around Mitian village and nearby villages, spread in about 8 sq Kms. We delved deep into streamflows, vegetation, topography, formations and also remote sensing imagery to produce an exciting work on hydrology, satellite imagery and GIS, which helps the planners reverse the recent declining trends observed in spring discharges.
Hydrology using remote sensing
Waterbodies downstream of a dam
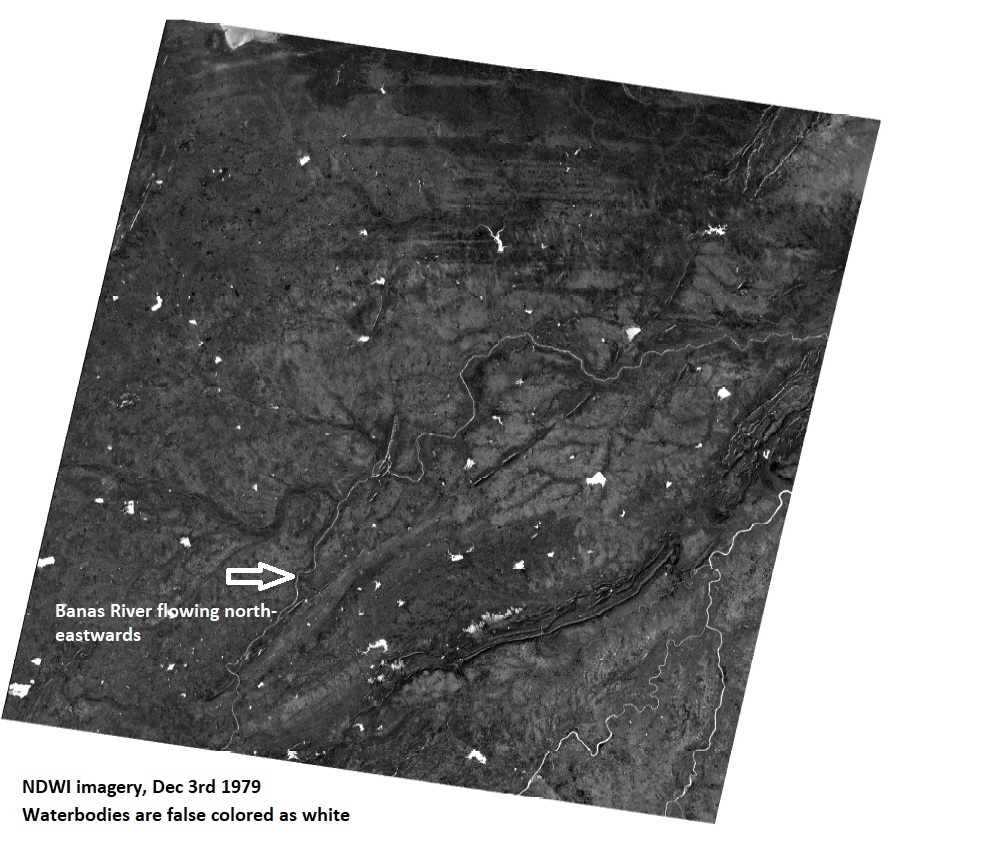
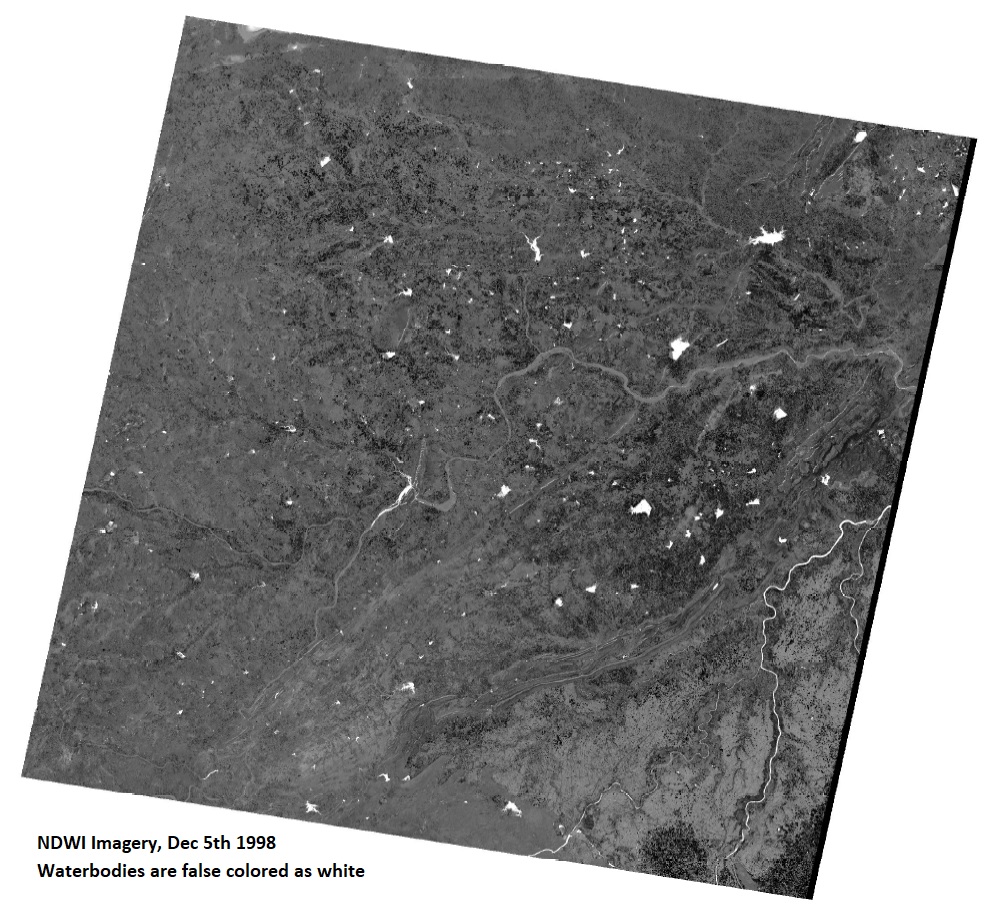
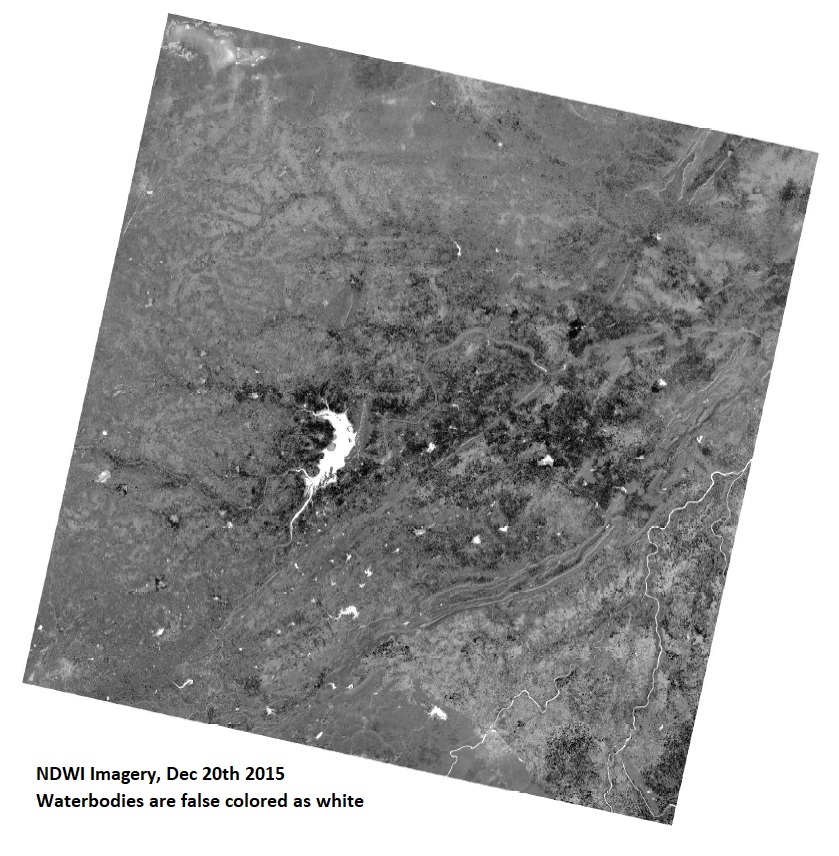
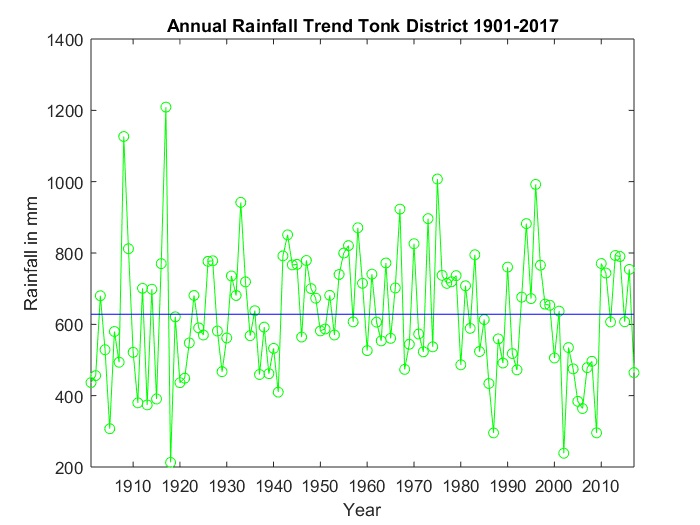
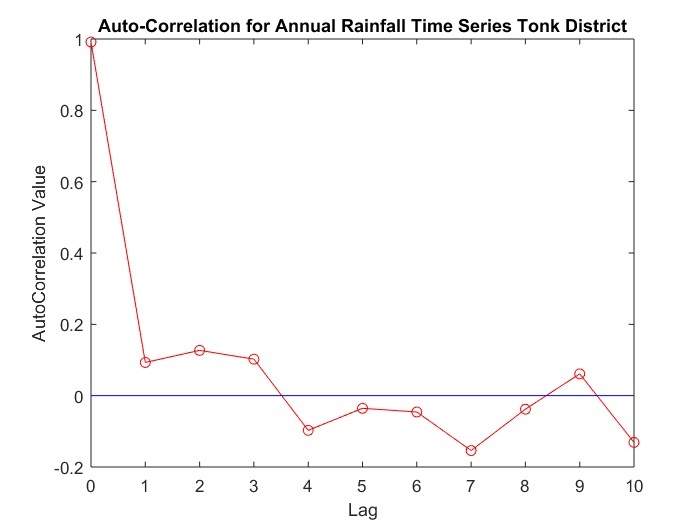
This was a project that looked into the state of waterbodies downstream of Bisalpur dam in Tonk and Sawai Madhopur districts of Rajasthan. The state of waterbodies downstream of this dam have been a constant cause of worry for the locals because the environmental flow of River Banas, a tributary of Chambal has been disrupted. As a result, lot of the waterbodies have lost their volume and aquatic wildlife too has dwindled.
This study was to assess the spectral imagery acquired from Landsat missions and the weather data series, by using appropriate image processing and time-series simulation methods.
Sustainable Development Goals (SDGs)
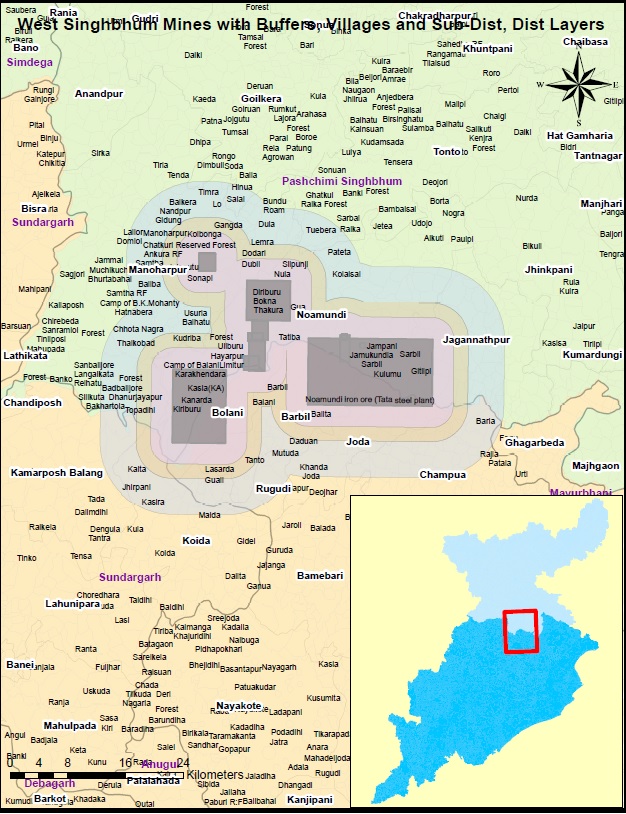
mapping of villages in mine buffer zones
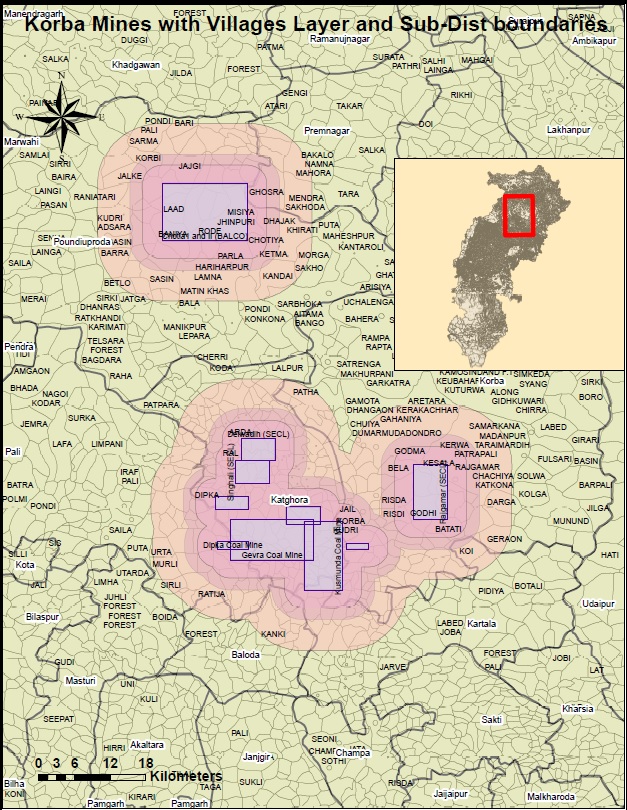
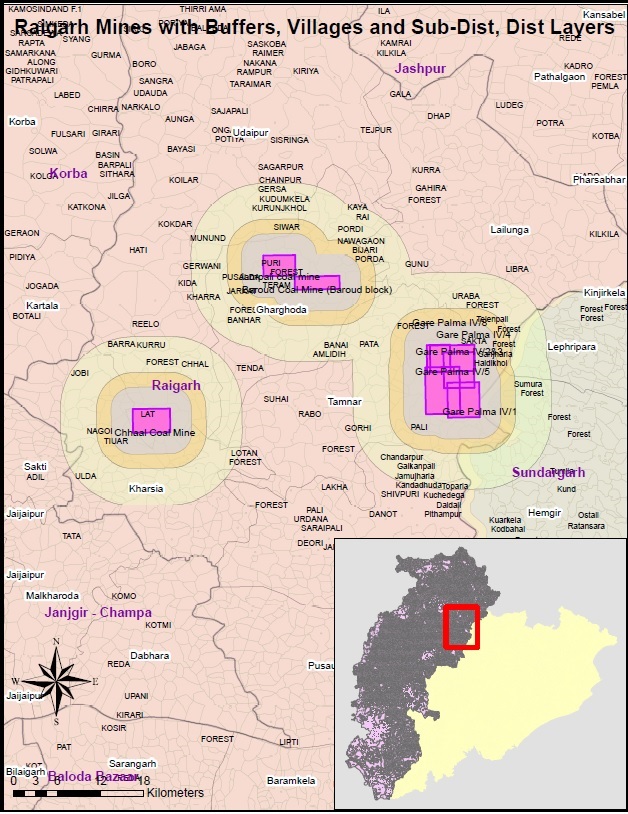
This project was to assess the utilization of fund under the District Mineral Foundation funds. DMF was instituted in March 2015 under the Mines and Minerals (Development and Regulation) Amendment Act as a benefit sharing mechanism with mining-affected communities, recognizing them as partners in natural-resource led development. However there had been calls of review into how much of the funds were actually being spent on the welfare of these communities.
This project looked at about 100+ mines in districts across Jharkhand, Chhatisgarh and Odisha. Using GIS techniques and data analysis, we estimated the number of households, residents and other parameters such as demographic details, social indicators etc. This work was in support of the report on utilization of DMF funds, authored by the Community Support team at the Centre for Science and Environment (CSE), Delhi.
Operations Analysis
OP Samvedna - GIS & ANALYTICS support
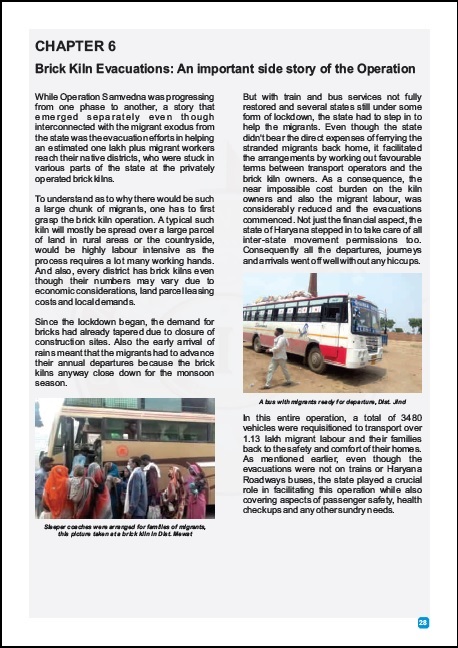
Due to the CoVid-19 pandemic and its collateral effect on the economy, there was a surge of unemployed and homeless people from the unorganized sectors of the economy, many of whom were migrant workers from faraway states. Like the rest of India, state of Haryana was grappling with this issue in the months of March & April 2020 with thousands of migrant workers registering for state support.
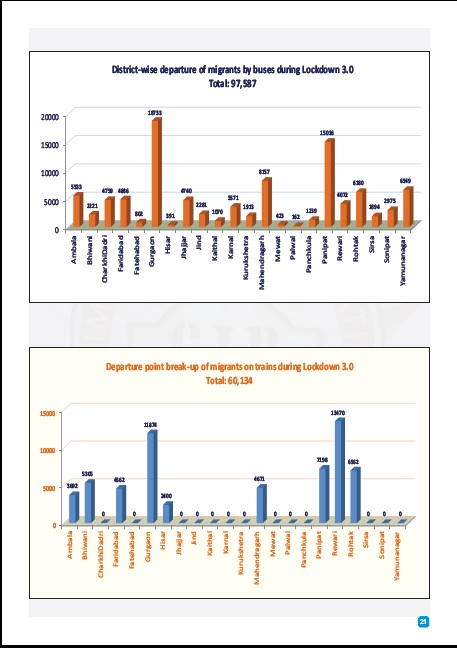
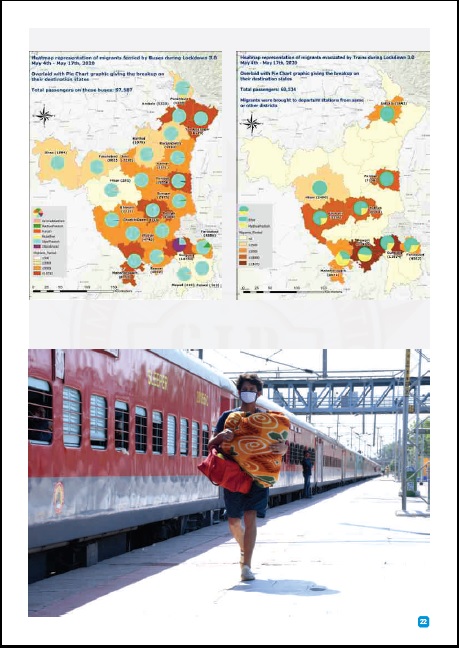
To alleviate their hardships, Haryana government had launched Operation Samvedna (Operation Empathy) under which about four lakh (four hundred thousand) migrant workers along with their families were sheltered, provided with food and medical aid, and eventually repatriated to their home states using the Indian Railways Shramik Express trains and Haryana state roadways buses.
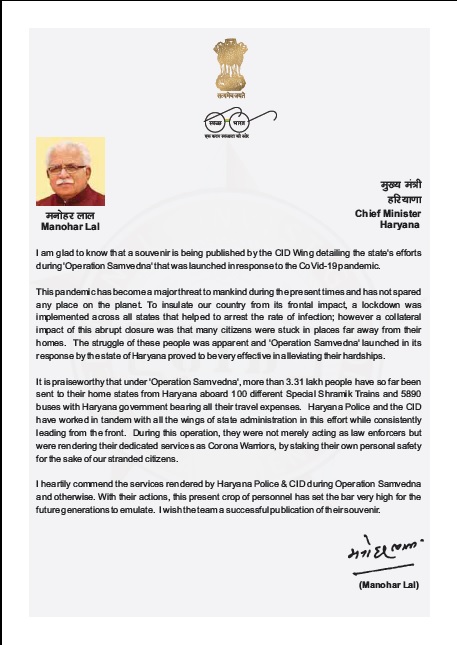
Sparrow Analytics provided GIS and Analysis Support during the operation and published a detailed analysis at its culmination. This analysis work was unveiled by the Hon’ble Chief Minister, Haryana – Sh. Manohar Lal, in the month of July 2020.
